Key Messages
Stark inequalities remain in the rates of baby death in the UK, especially when looking at ethnicity and socio-economic deprivation together.
- In 2023, wide ethnic inequalities remain with babies of Black ethnicity still more than twice as likely to be stillborn than babies of White ethnicity (5.84 compared to 2.71 per 1,000 births) (source: MBRRACE-UK)
- In 2023, babies of both Asian and Black ethnicity still have higher rates babies dying shortly after birth (neonatal mortality) than babies of White ethnicity (Asian 2.35 and Black 2.28 per 1,000 live births compared to 1.50 per 1,000 live births for White babies) (source: MBRRACE-UK)
- In 2023, while the difference in stillbirth rates for babies born to mothers living in the most and least deprived areas decreased slightly, the difference between most and least deprived increased when looking at babies who died shortly after birth (source: MBRRACE-UK)
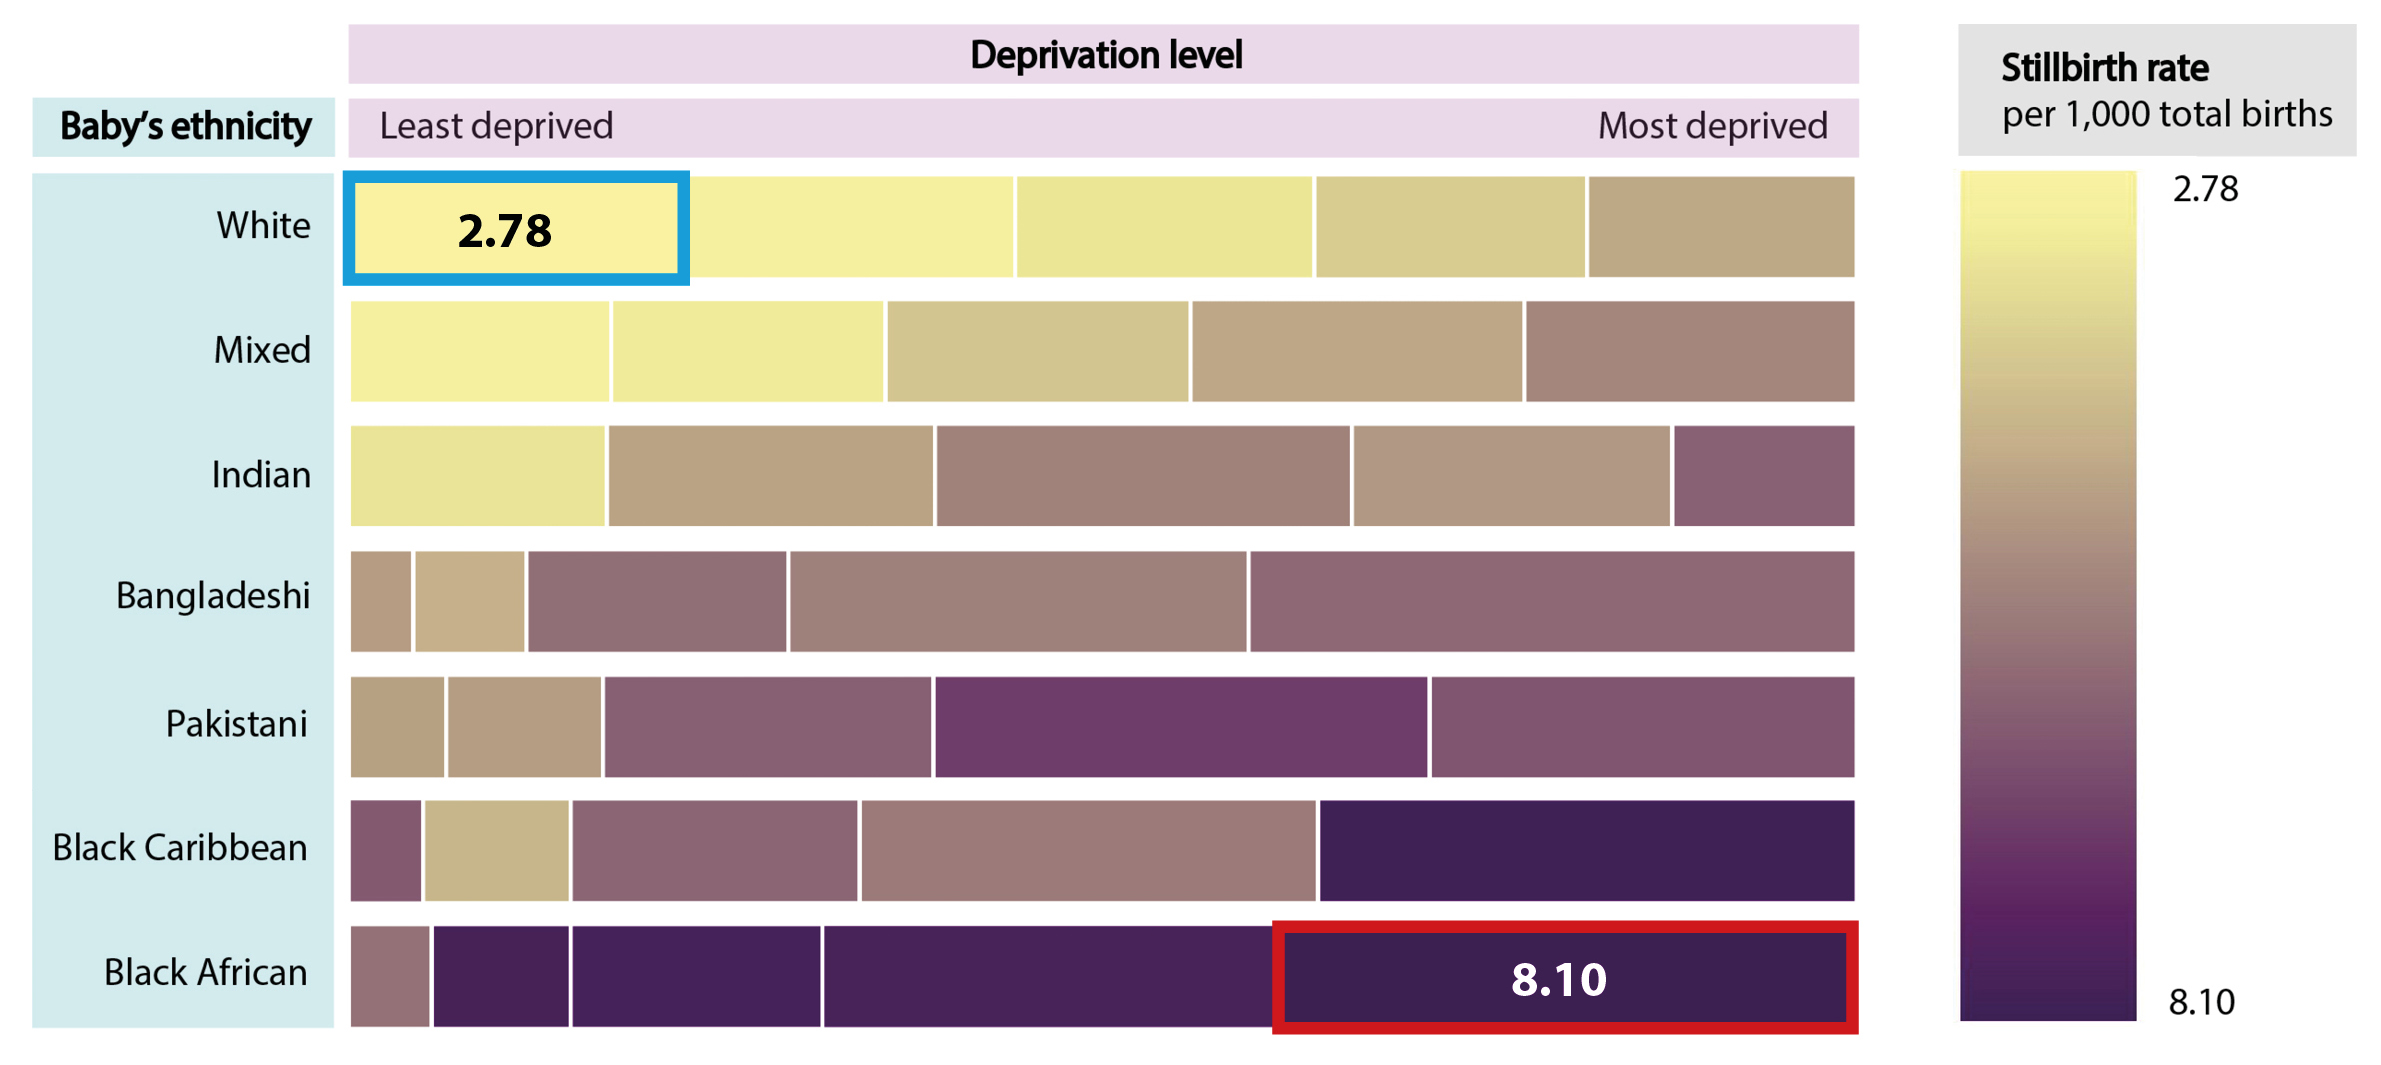
- From 2016 to 2020, babies of Black African ethnicity in the most deprived areas are 3x more likely to be stillborn than white babies from the least deprived areas (8.10 compared to 2.78 stillbirths per 1,000 births; source: MBRRACE-UK)
- From 2016 to 2020, babies of Pakistani ethnicity in the more deprived areas are 3.5x more likely to die shortly after birth than white babies from the least deprived areas (4.14 compared to 1.26 stillbirths per 1,000 births; source: MBRRACE-UK)
It can be difficult to understand what risk messages actually mean for each individual baby. Read our statistics guide to find out more about how risks are communicated and why this matters.
This information was last reviewed in July 2025.
More Information
You can find out more about the most recent data for 2023 around ethnicity and socio-economic deprivation and stillbirth and neonatal death rates in the MBRRACE-UK State of the Nation report.
Representing the different ethnicities and socio-economic deprivation groups together in one diagram is a challenge, but the heatmaps below give a useful indication of how the two factors are interlinked. It also shows the differences in the percentage of each ethnicity group living in each socio-economic deprivation level.
These heatmaps show the differences in stillbirth and neonatal death rate for different ethnicity groups by socio-economic deprivation level for the time period 2016-2020.
If you are using a mobile device, try viewing the heatmaps below in landscape orientation.


Attribution: Draper ES, Gallimore ID, Smith LK, Matthews RJ, Fenton AC, Kurinczuk JJ, Smith PW, Manktelow BN, on behalf of the MBRRACE-UK Collaboration. MBRRACE-UK Perinatal Mortality Surveillance Report, UK Perinatal Deaths for Births from January to December 2020: Lay summary. Leicester: The Infant Mortality and Morbidity Studies, Department of Health Sciences, University of Leicester. 2022.
